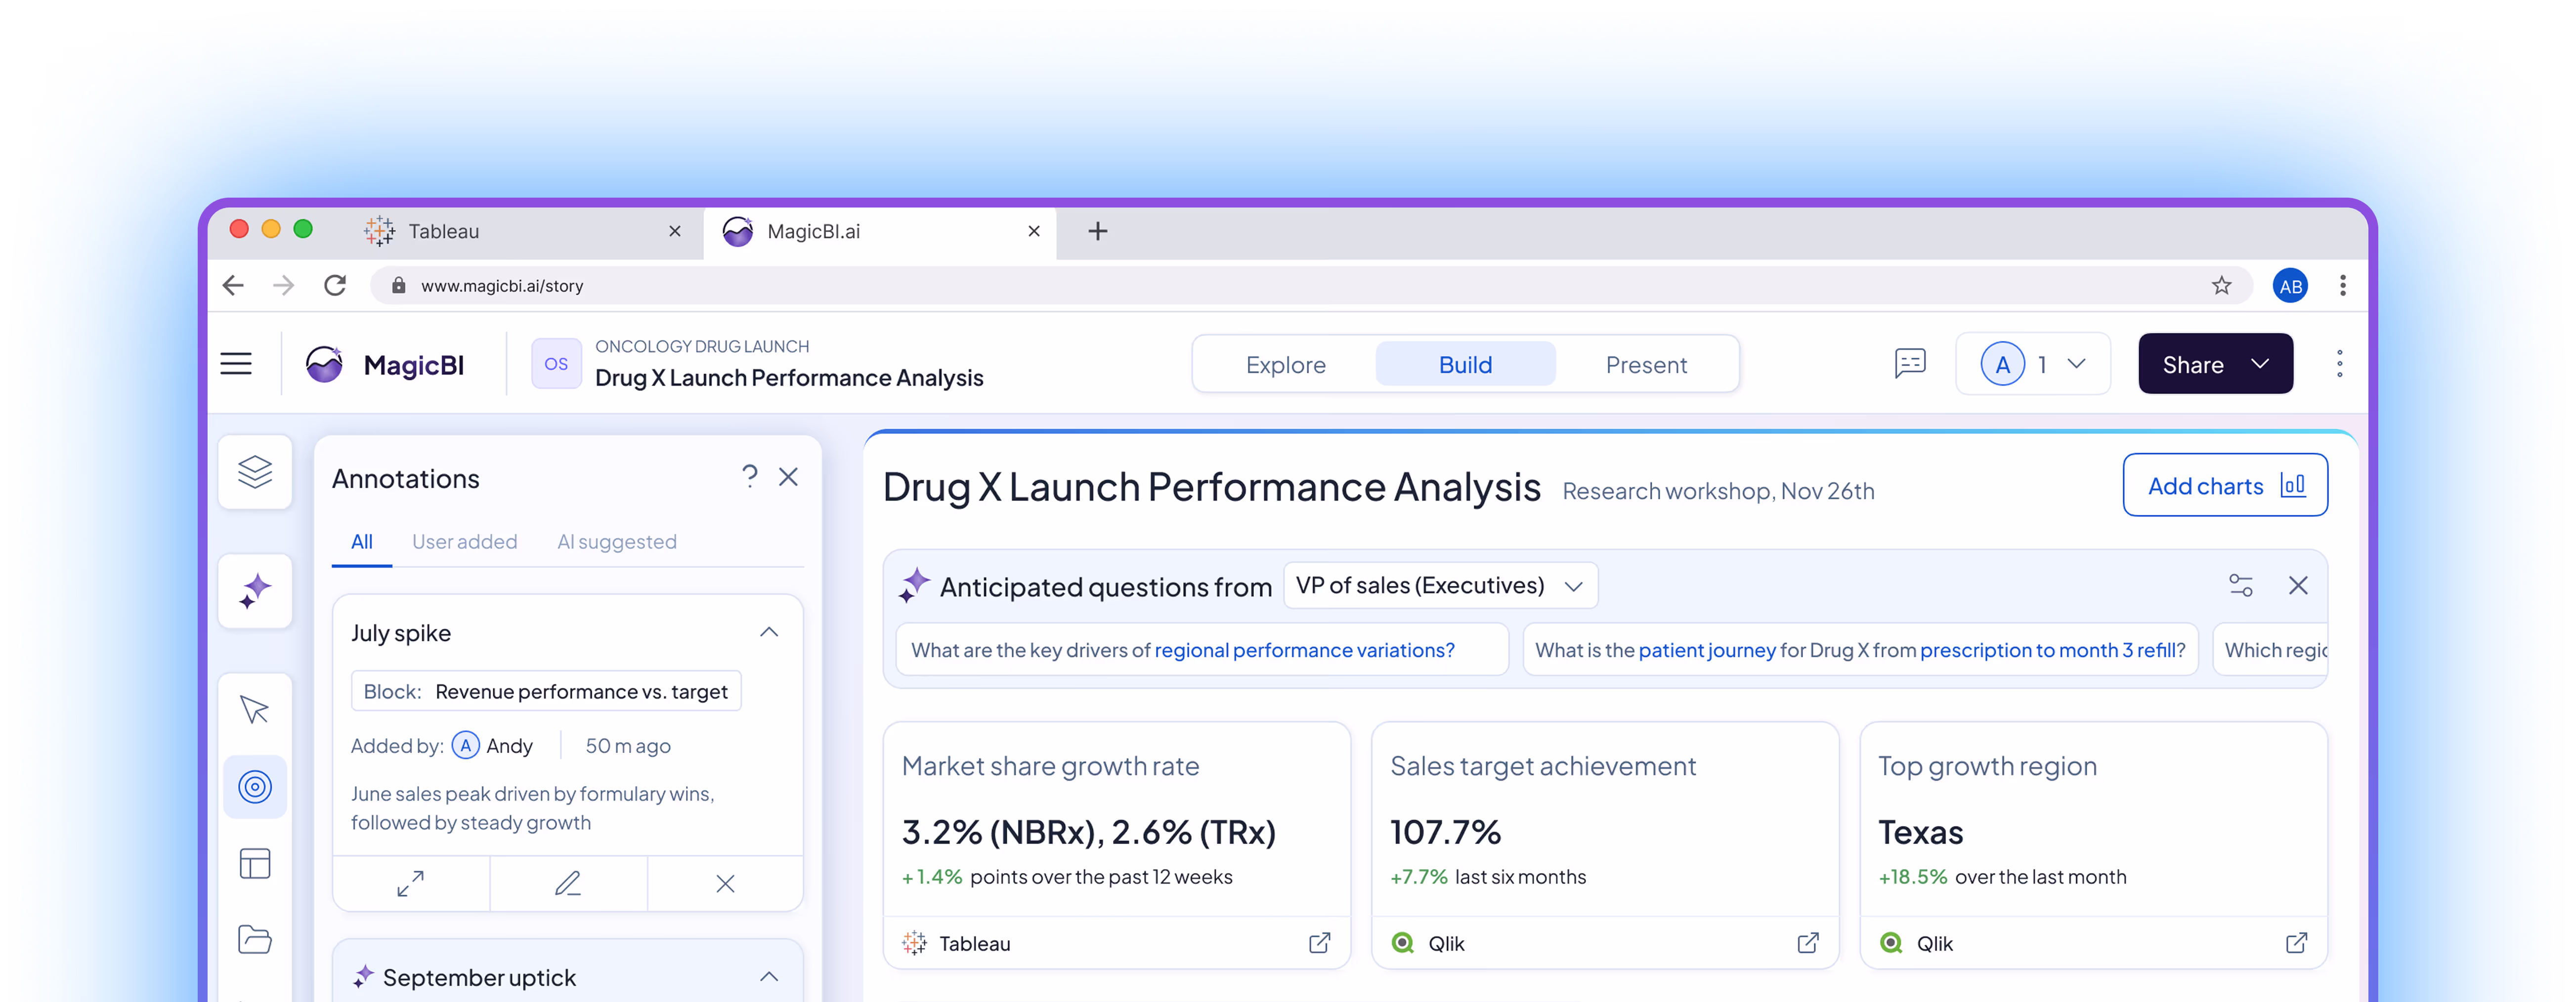
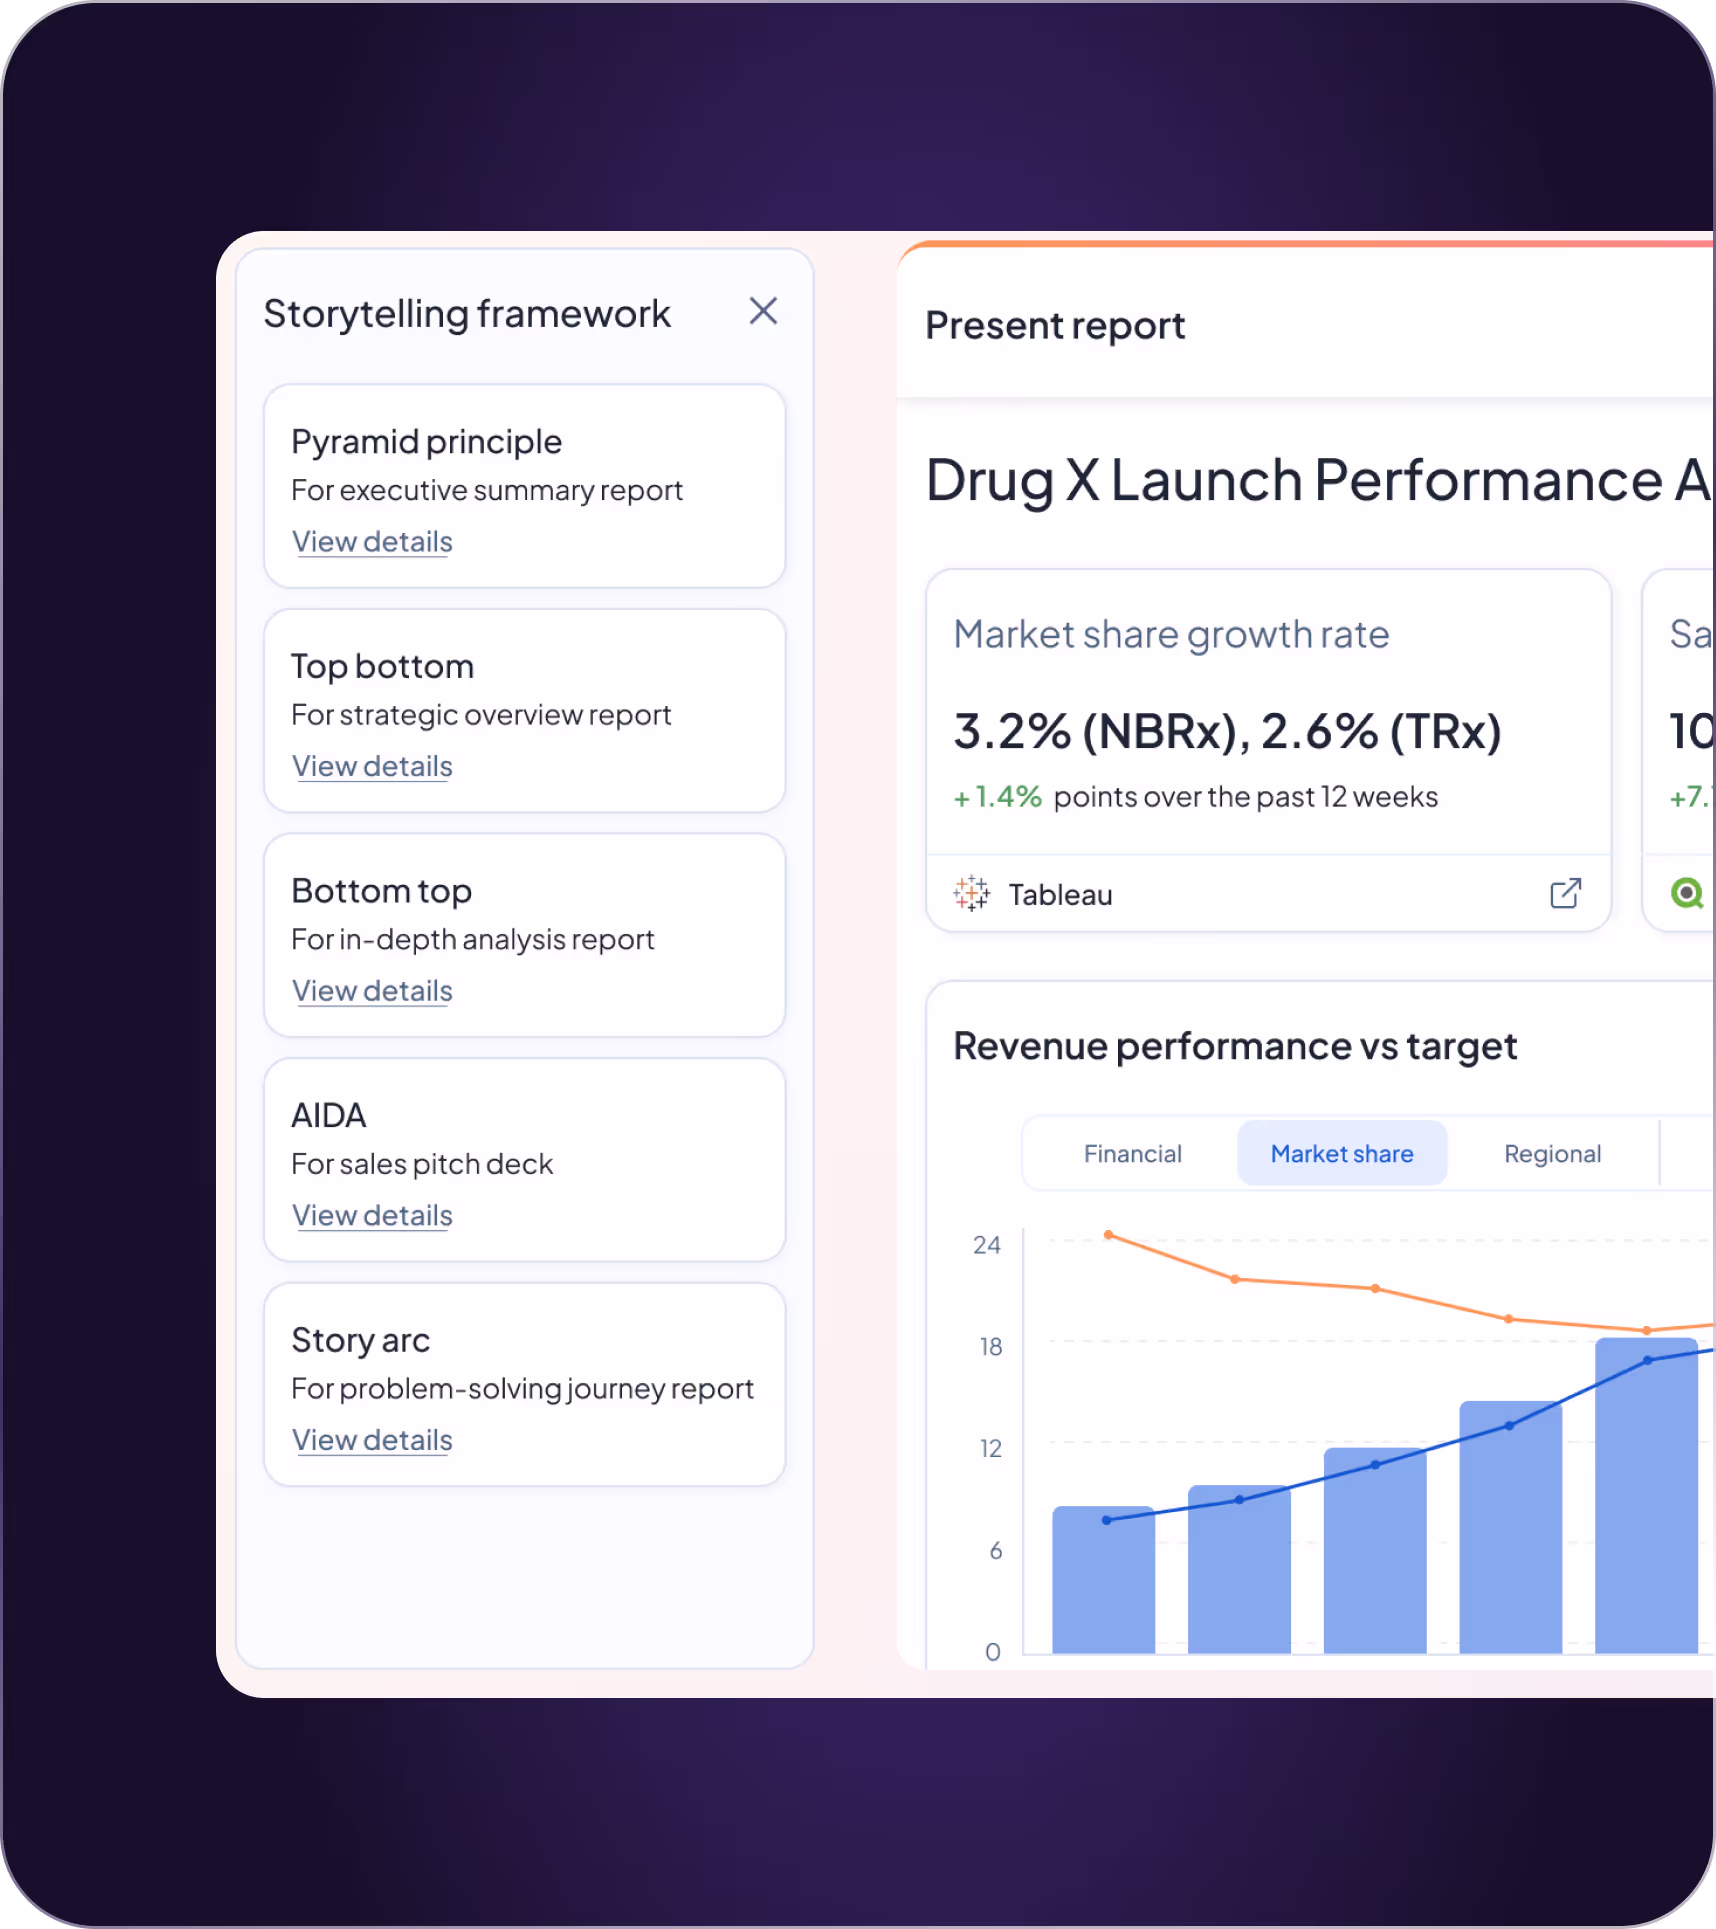
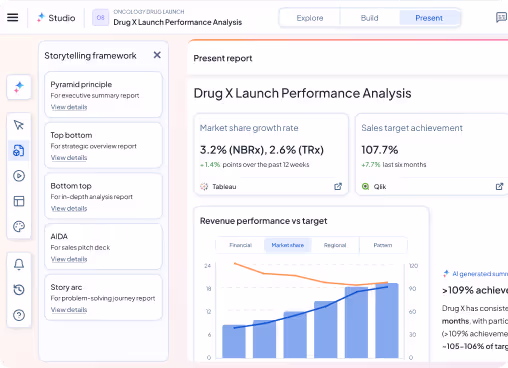
Data Storytelling,
for everyone
for everyone
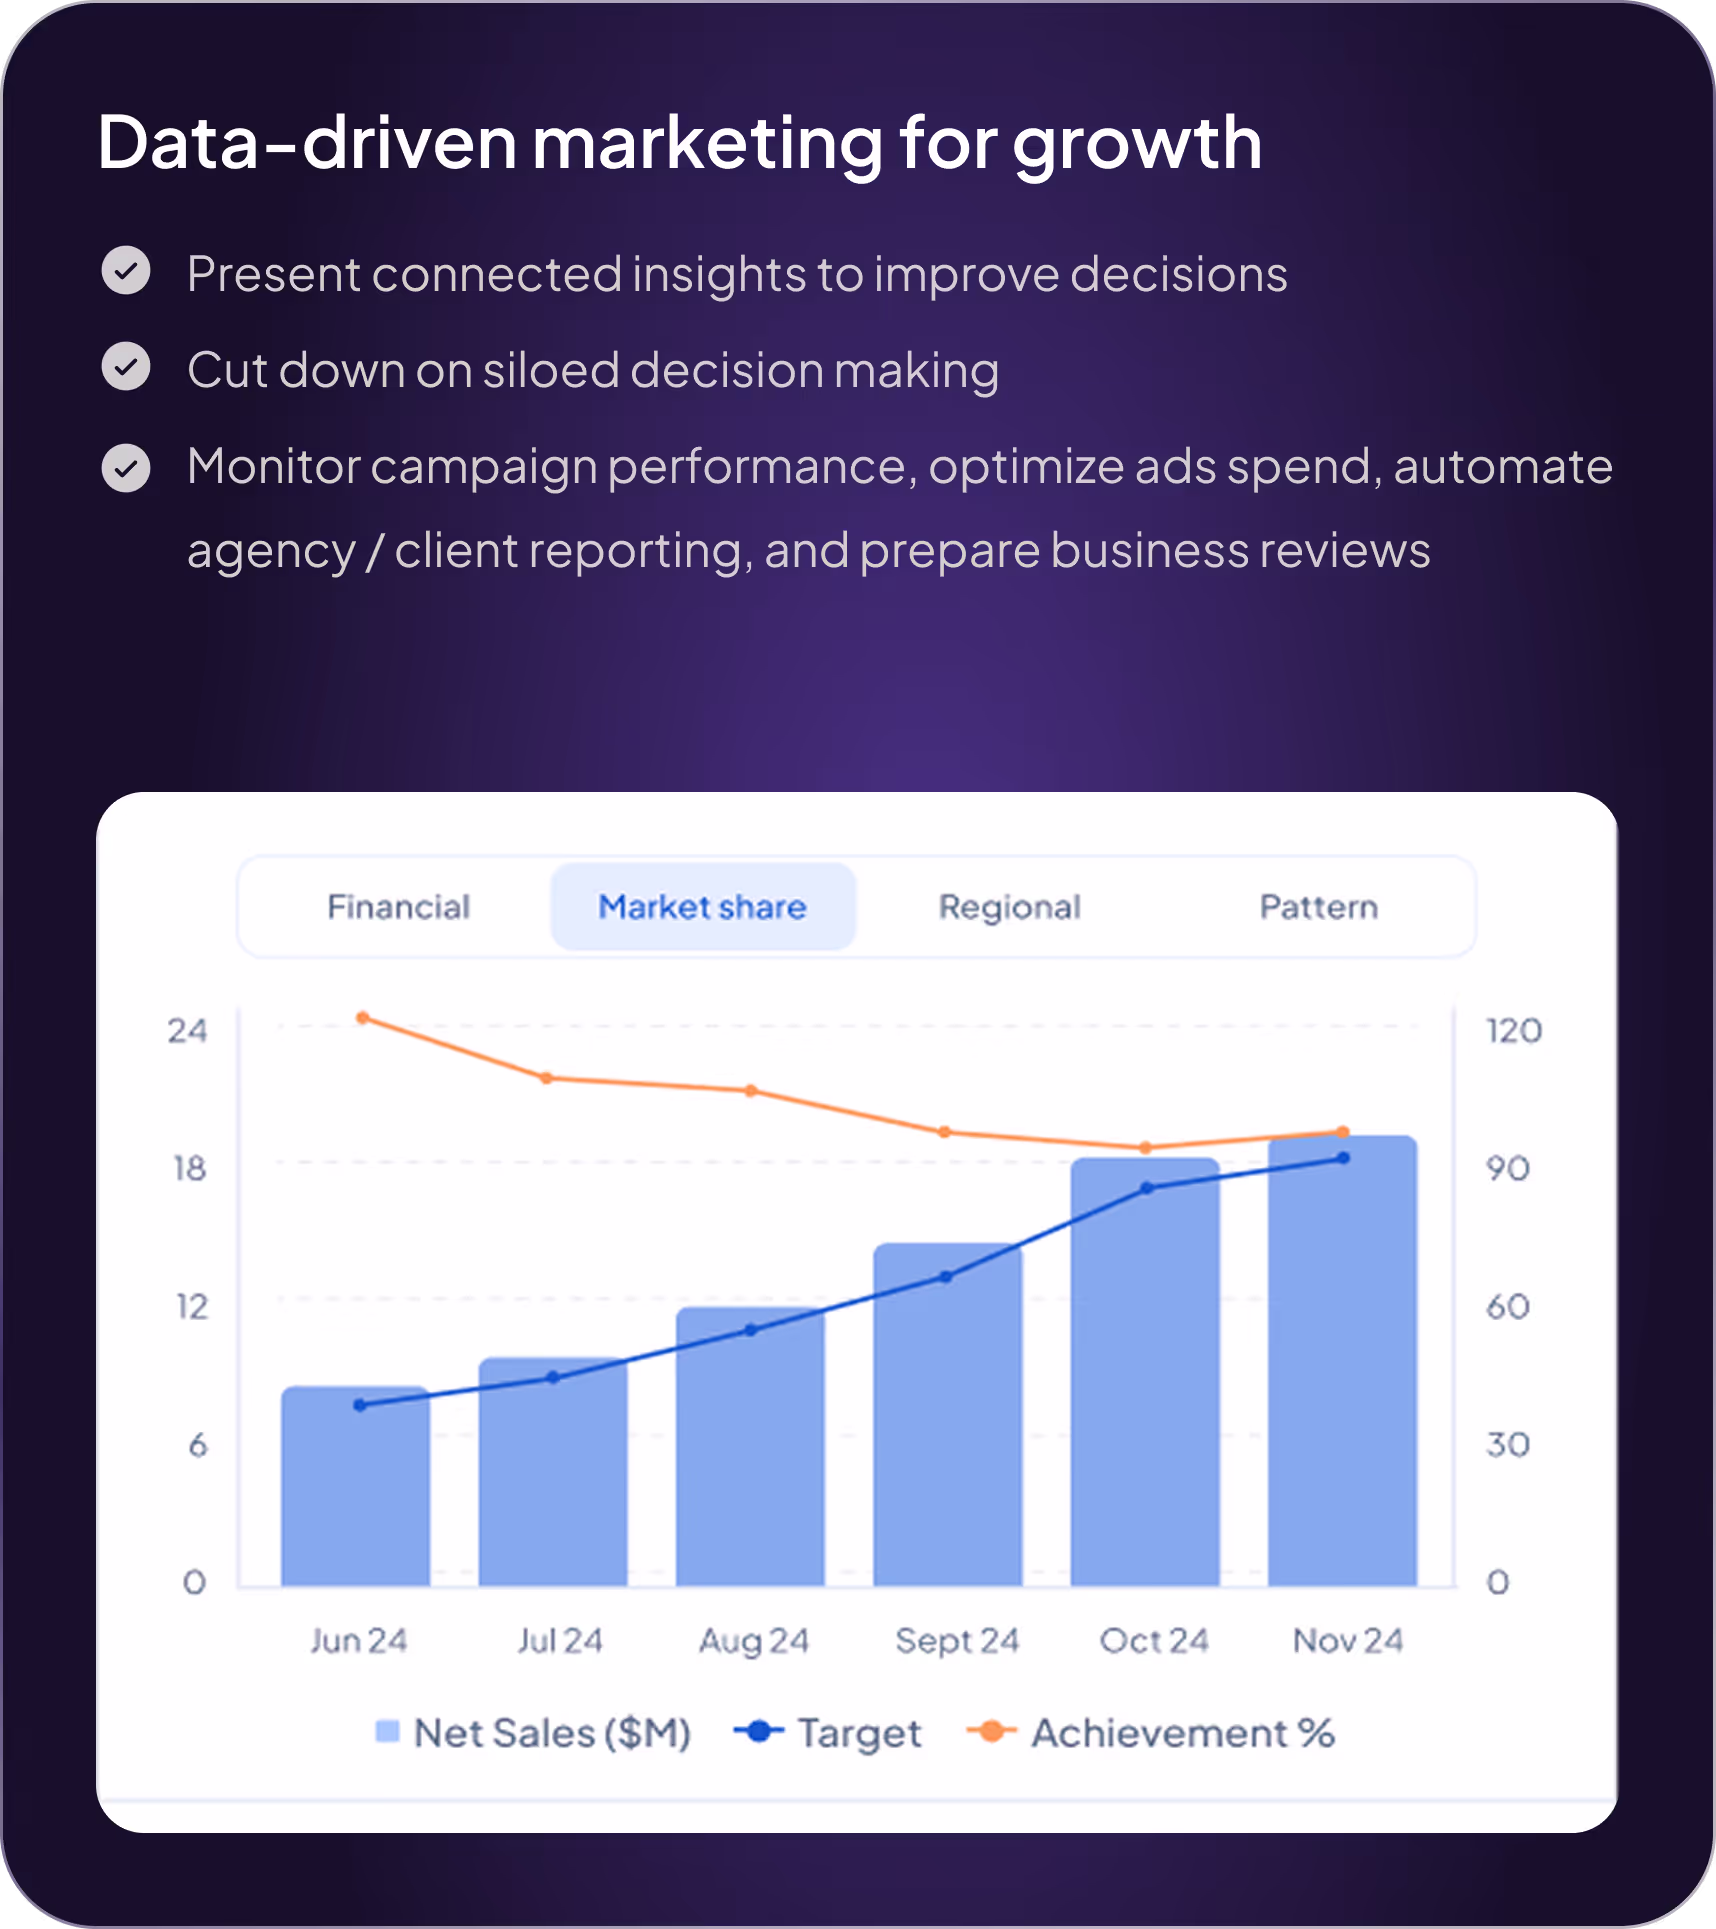
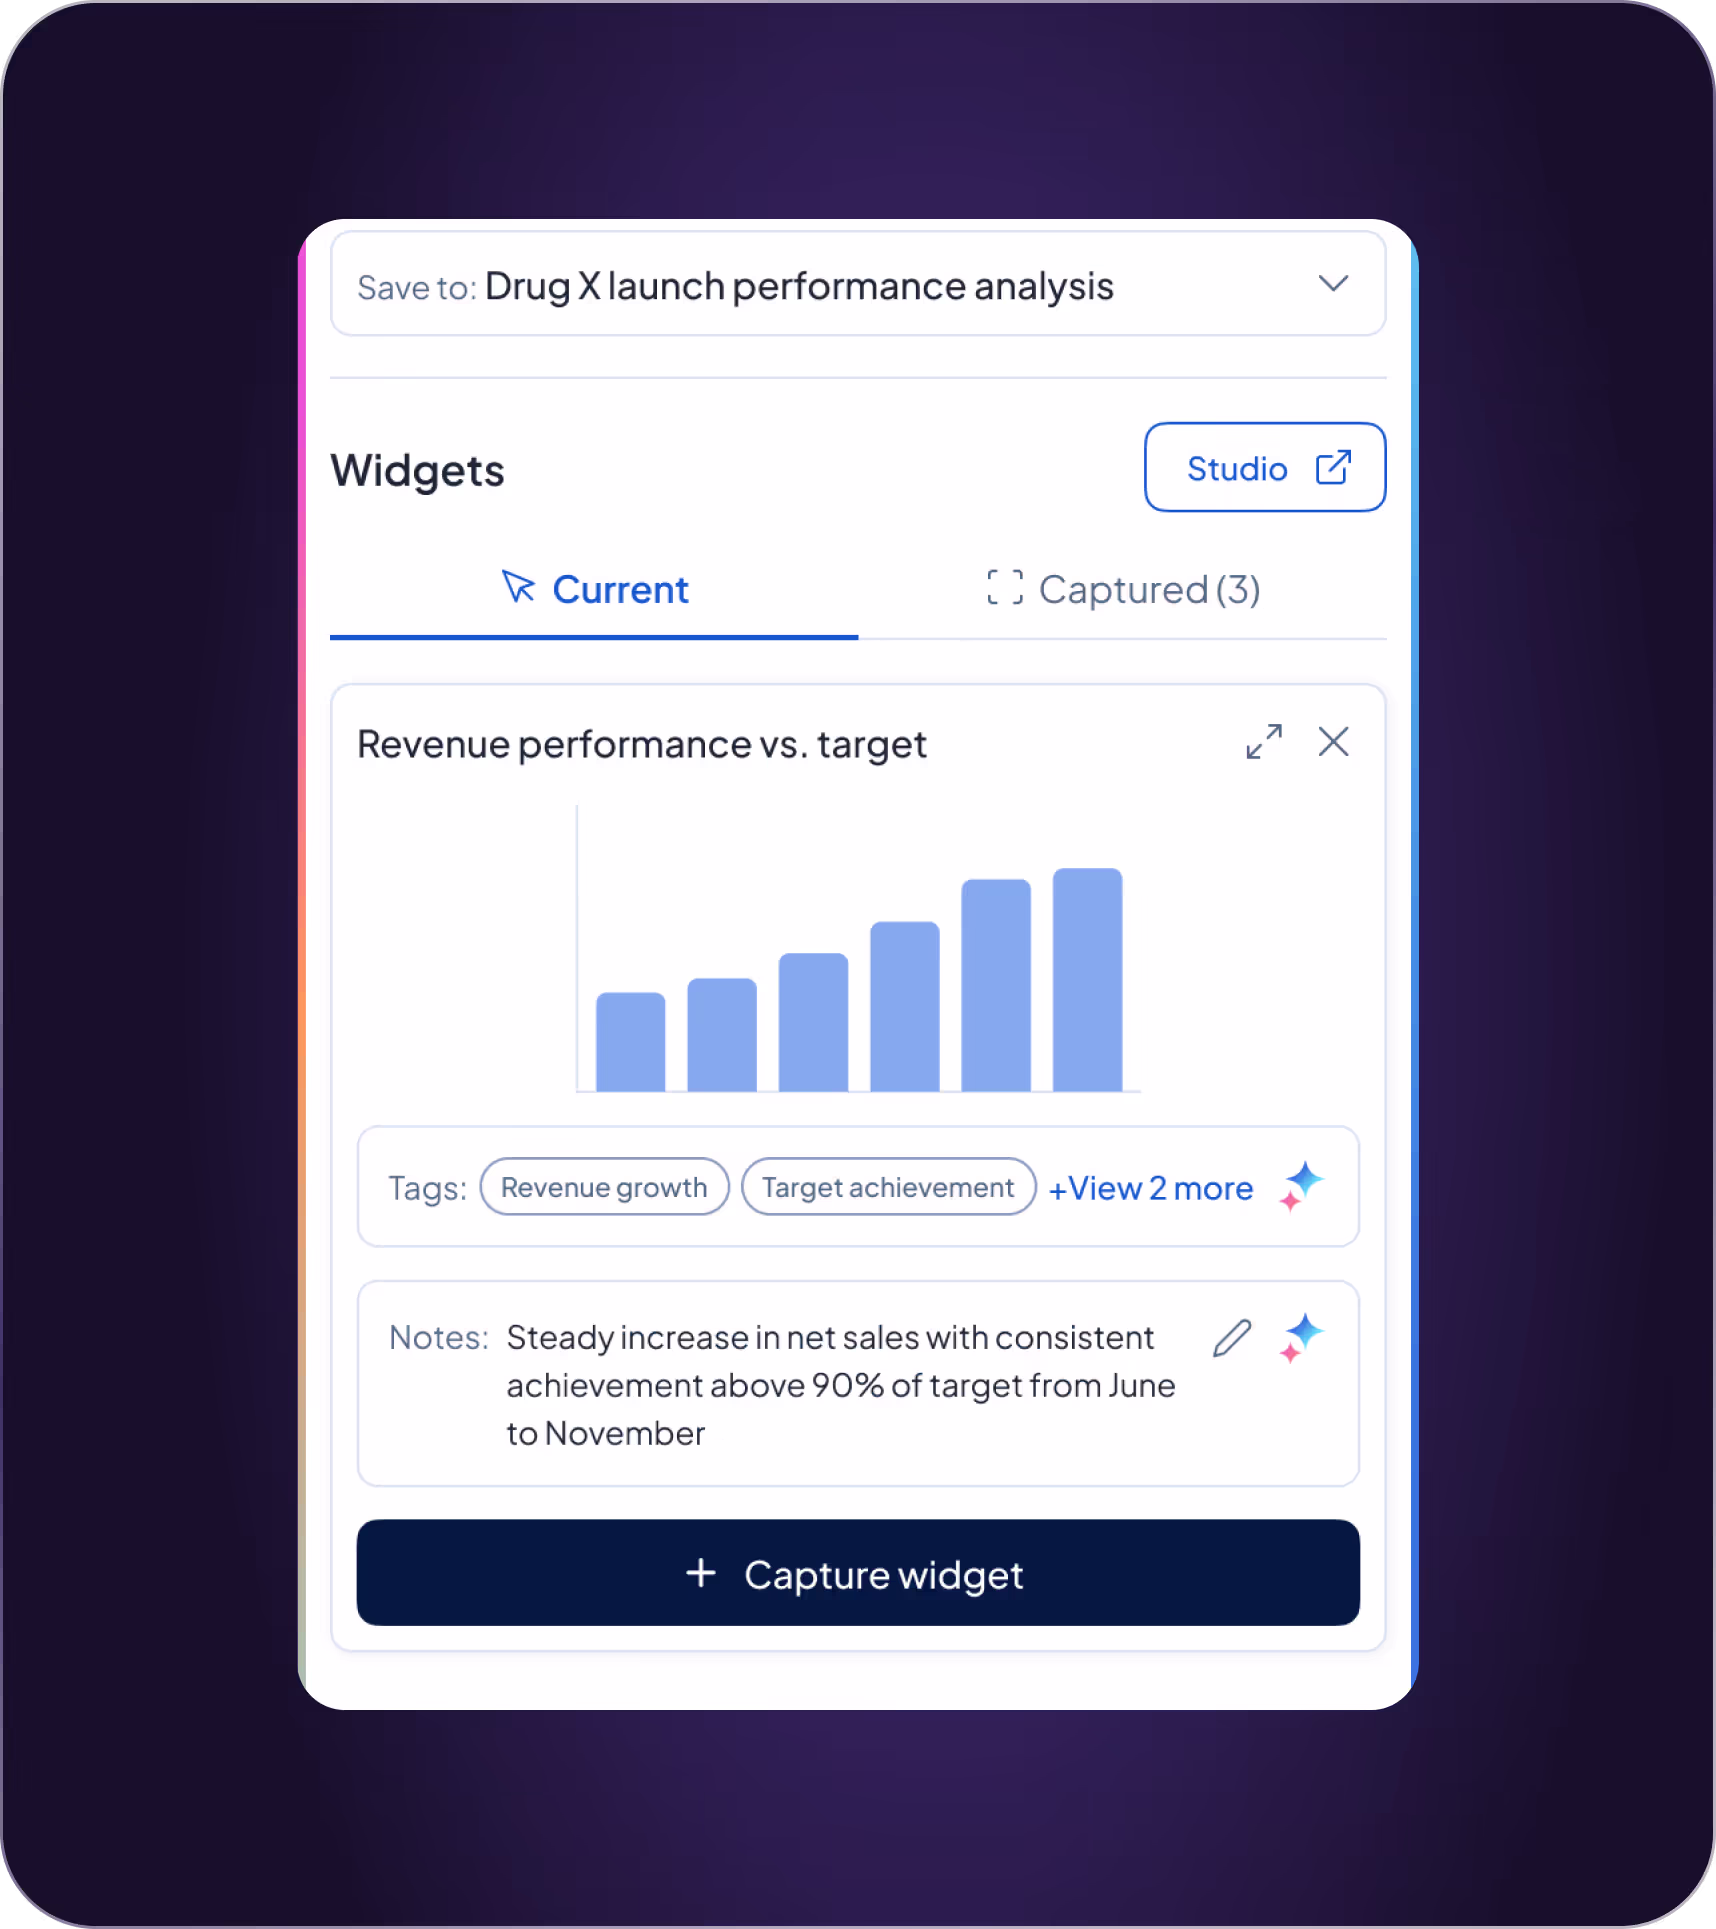
MagicBI's autonomous analytics connects to all your data, learns your business, and turns questions into decisions.
Oops! Something went wrong!
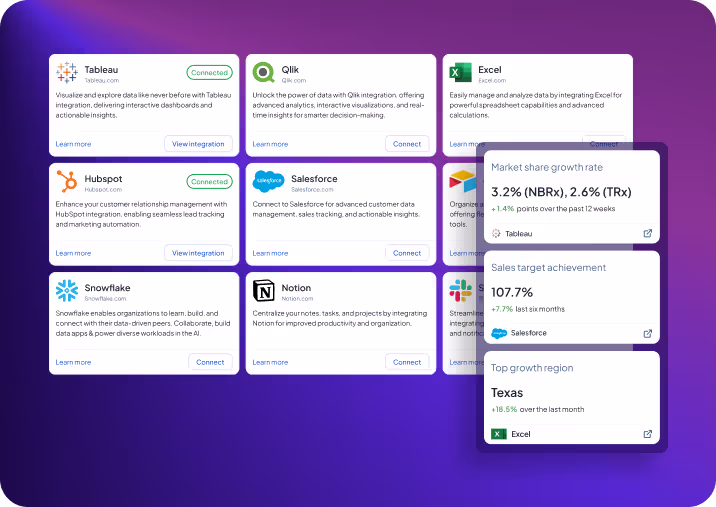
Connects to your entire stack
.svg)
.svg)
.svg)
.svg)
.svg)
.svg)
.svg)

Tableau
Looker
PowerBI
Qlik
Salesforce
Hubspot
Gainsight
Snowflake
Databricks
BigQuery
Excel
PPT
PDF
Gong
Slack
Email


.svg)


.svg)


.svg)
.svg)